Know which customer costs what.
Per-customer prosumer attribution for Romanian energy retailers. 363,155 geocoded installations, 15-minute DAMAS prices, one platform.
- 363,155
- Geocoded prosumers
- 15 min
- Price granularity
- 13%
- Attribution error (MAPE)
- 8 / 8
- Distribution zones
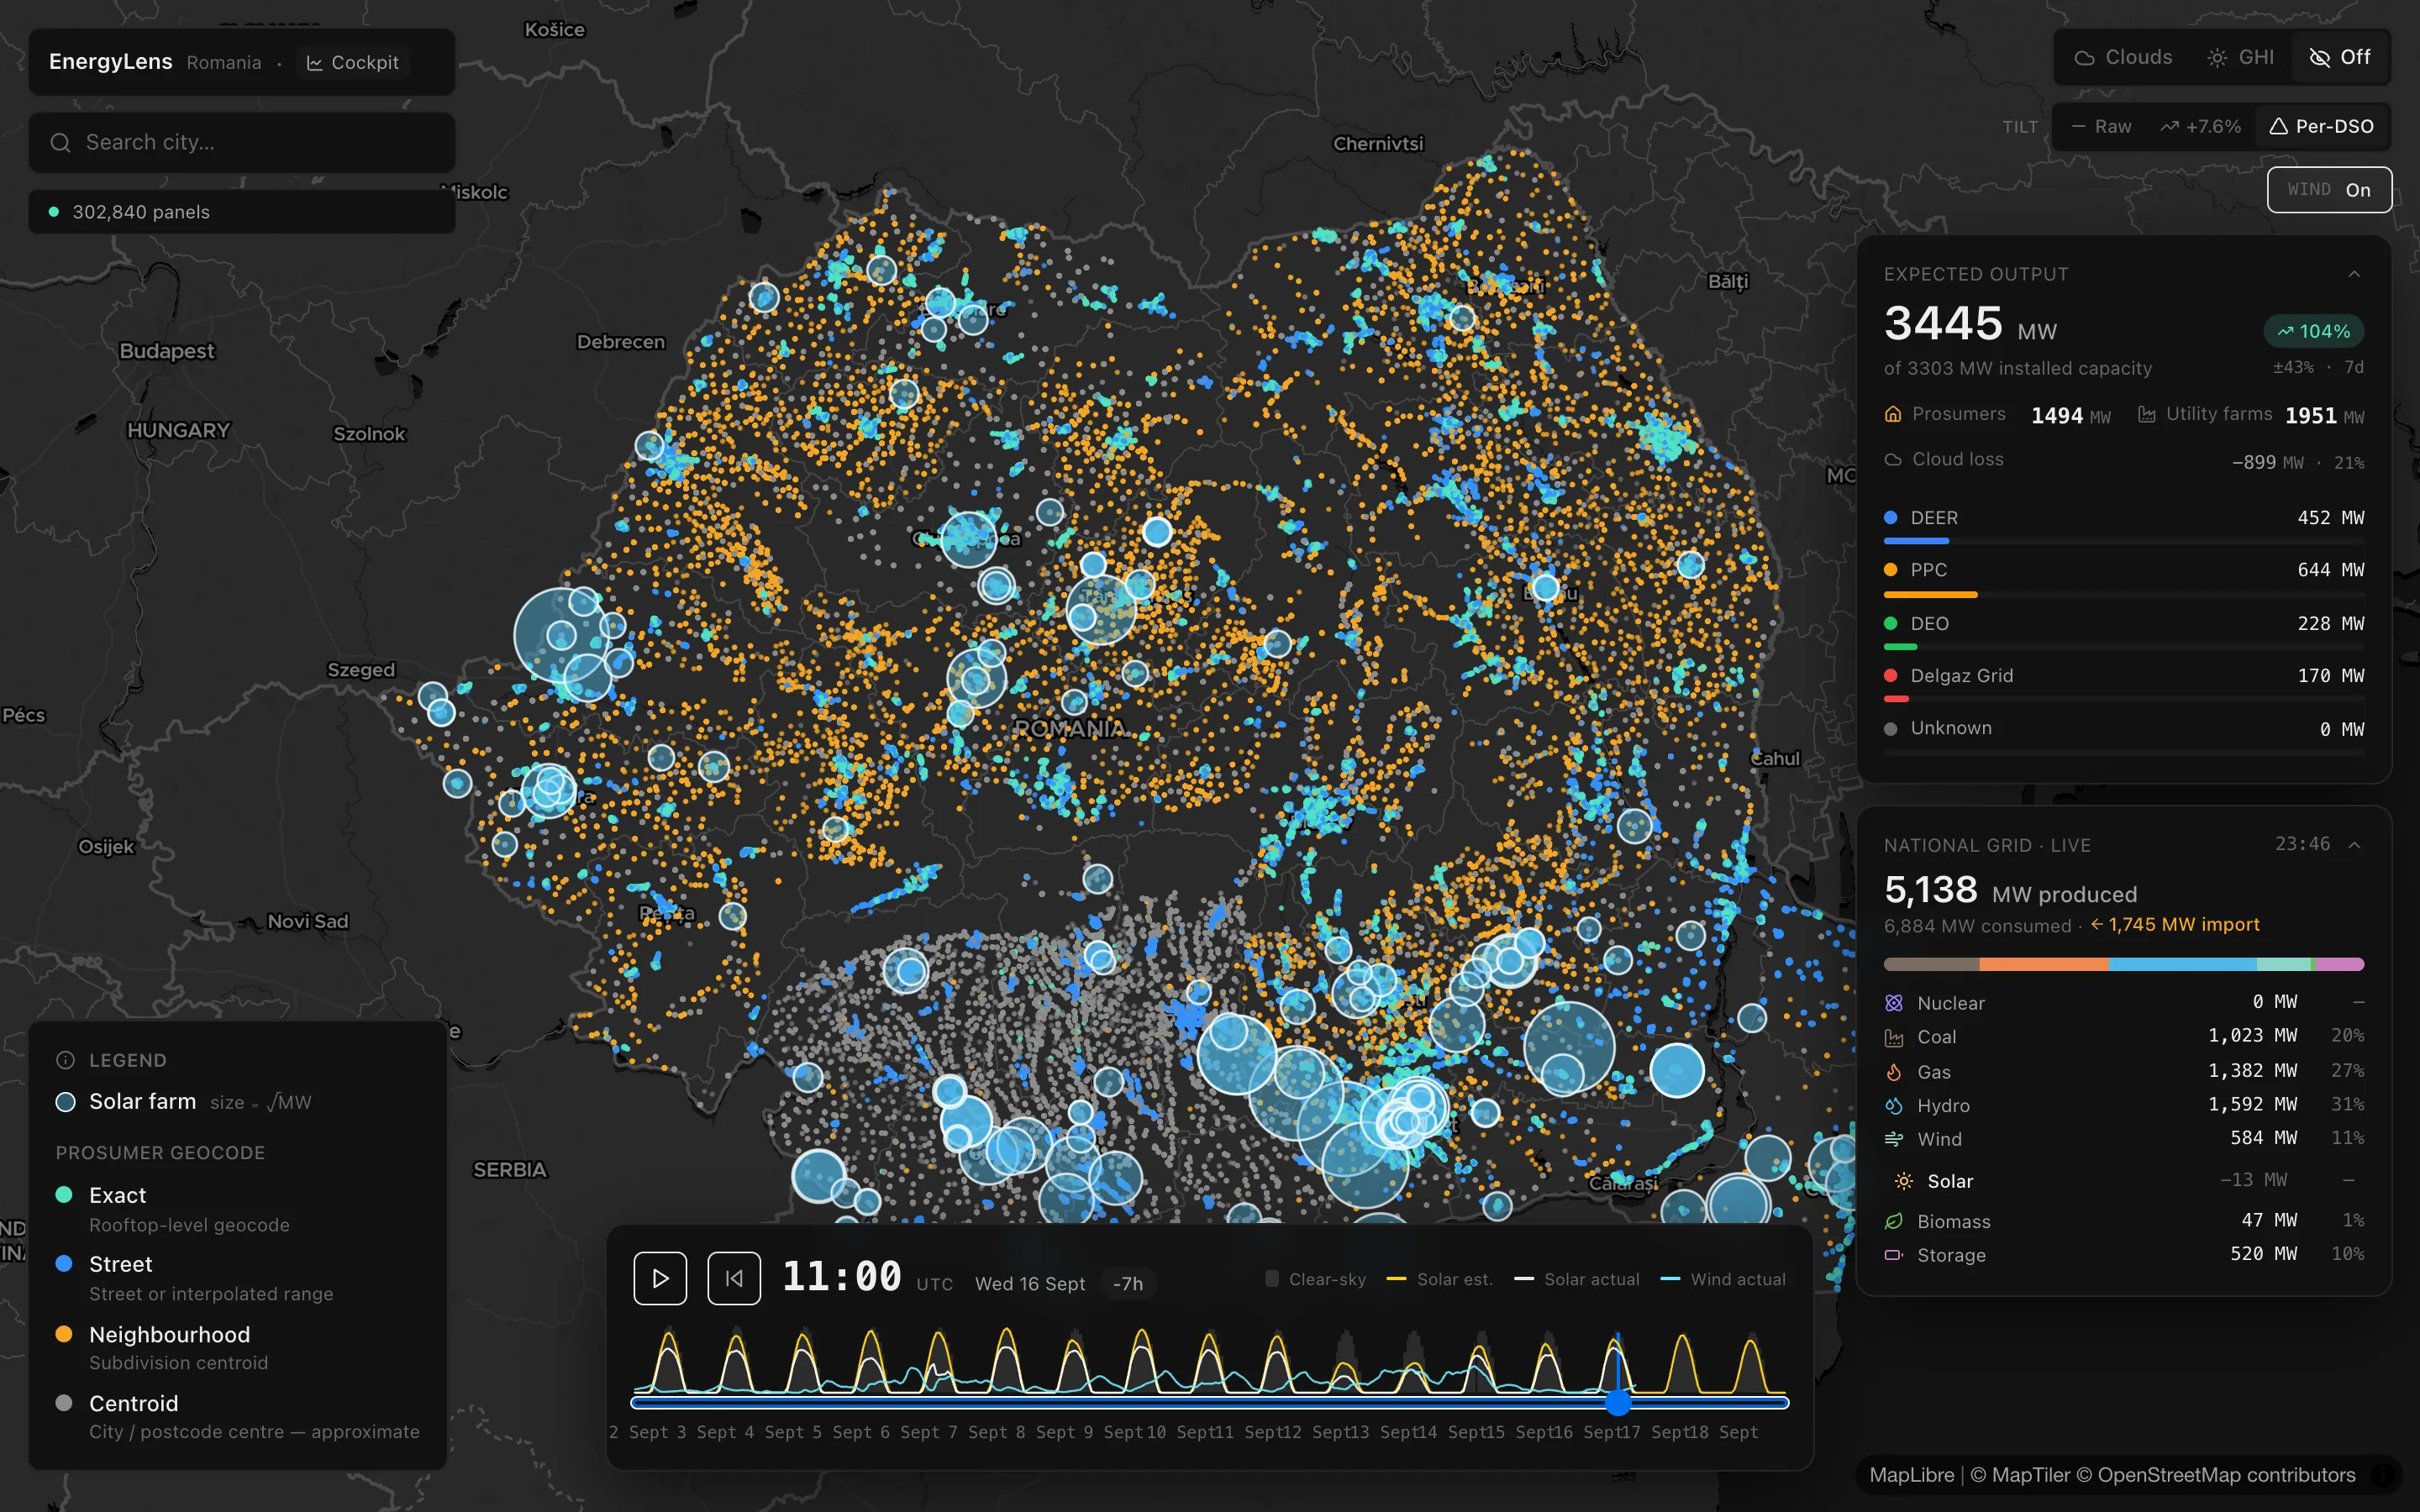
Every prosumer, geocoded to the rooftop.
302,840 panels across all eight distribution zones, with expected output modelled hour by hour from cloud cover. Scrub 17 days of history or zoom to a single street.
Open the map →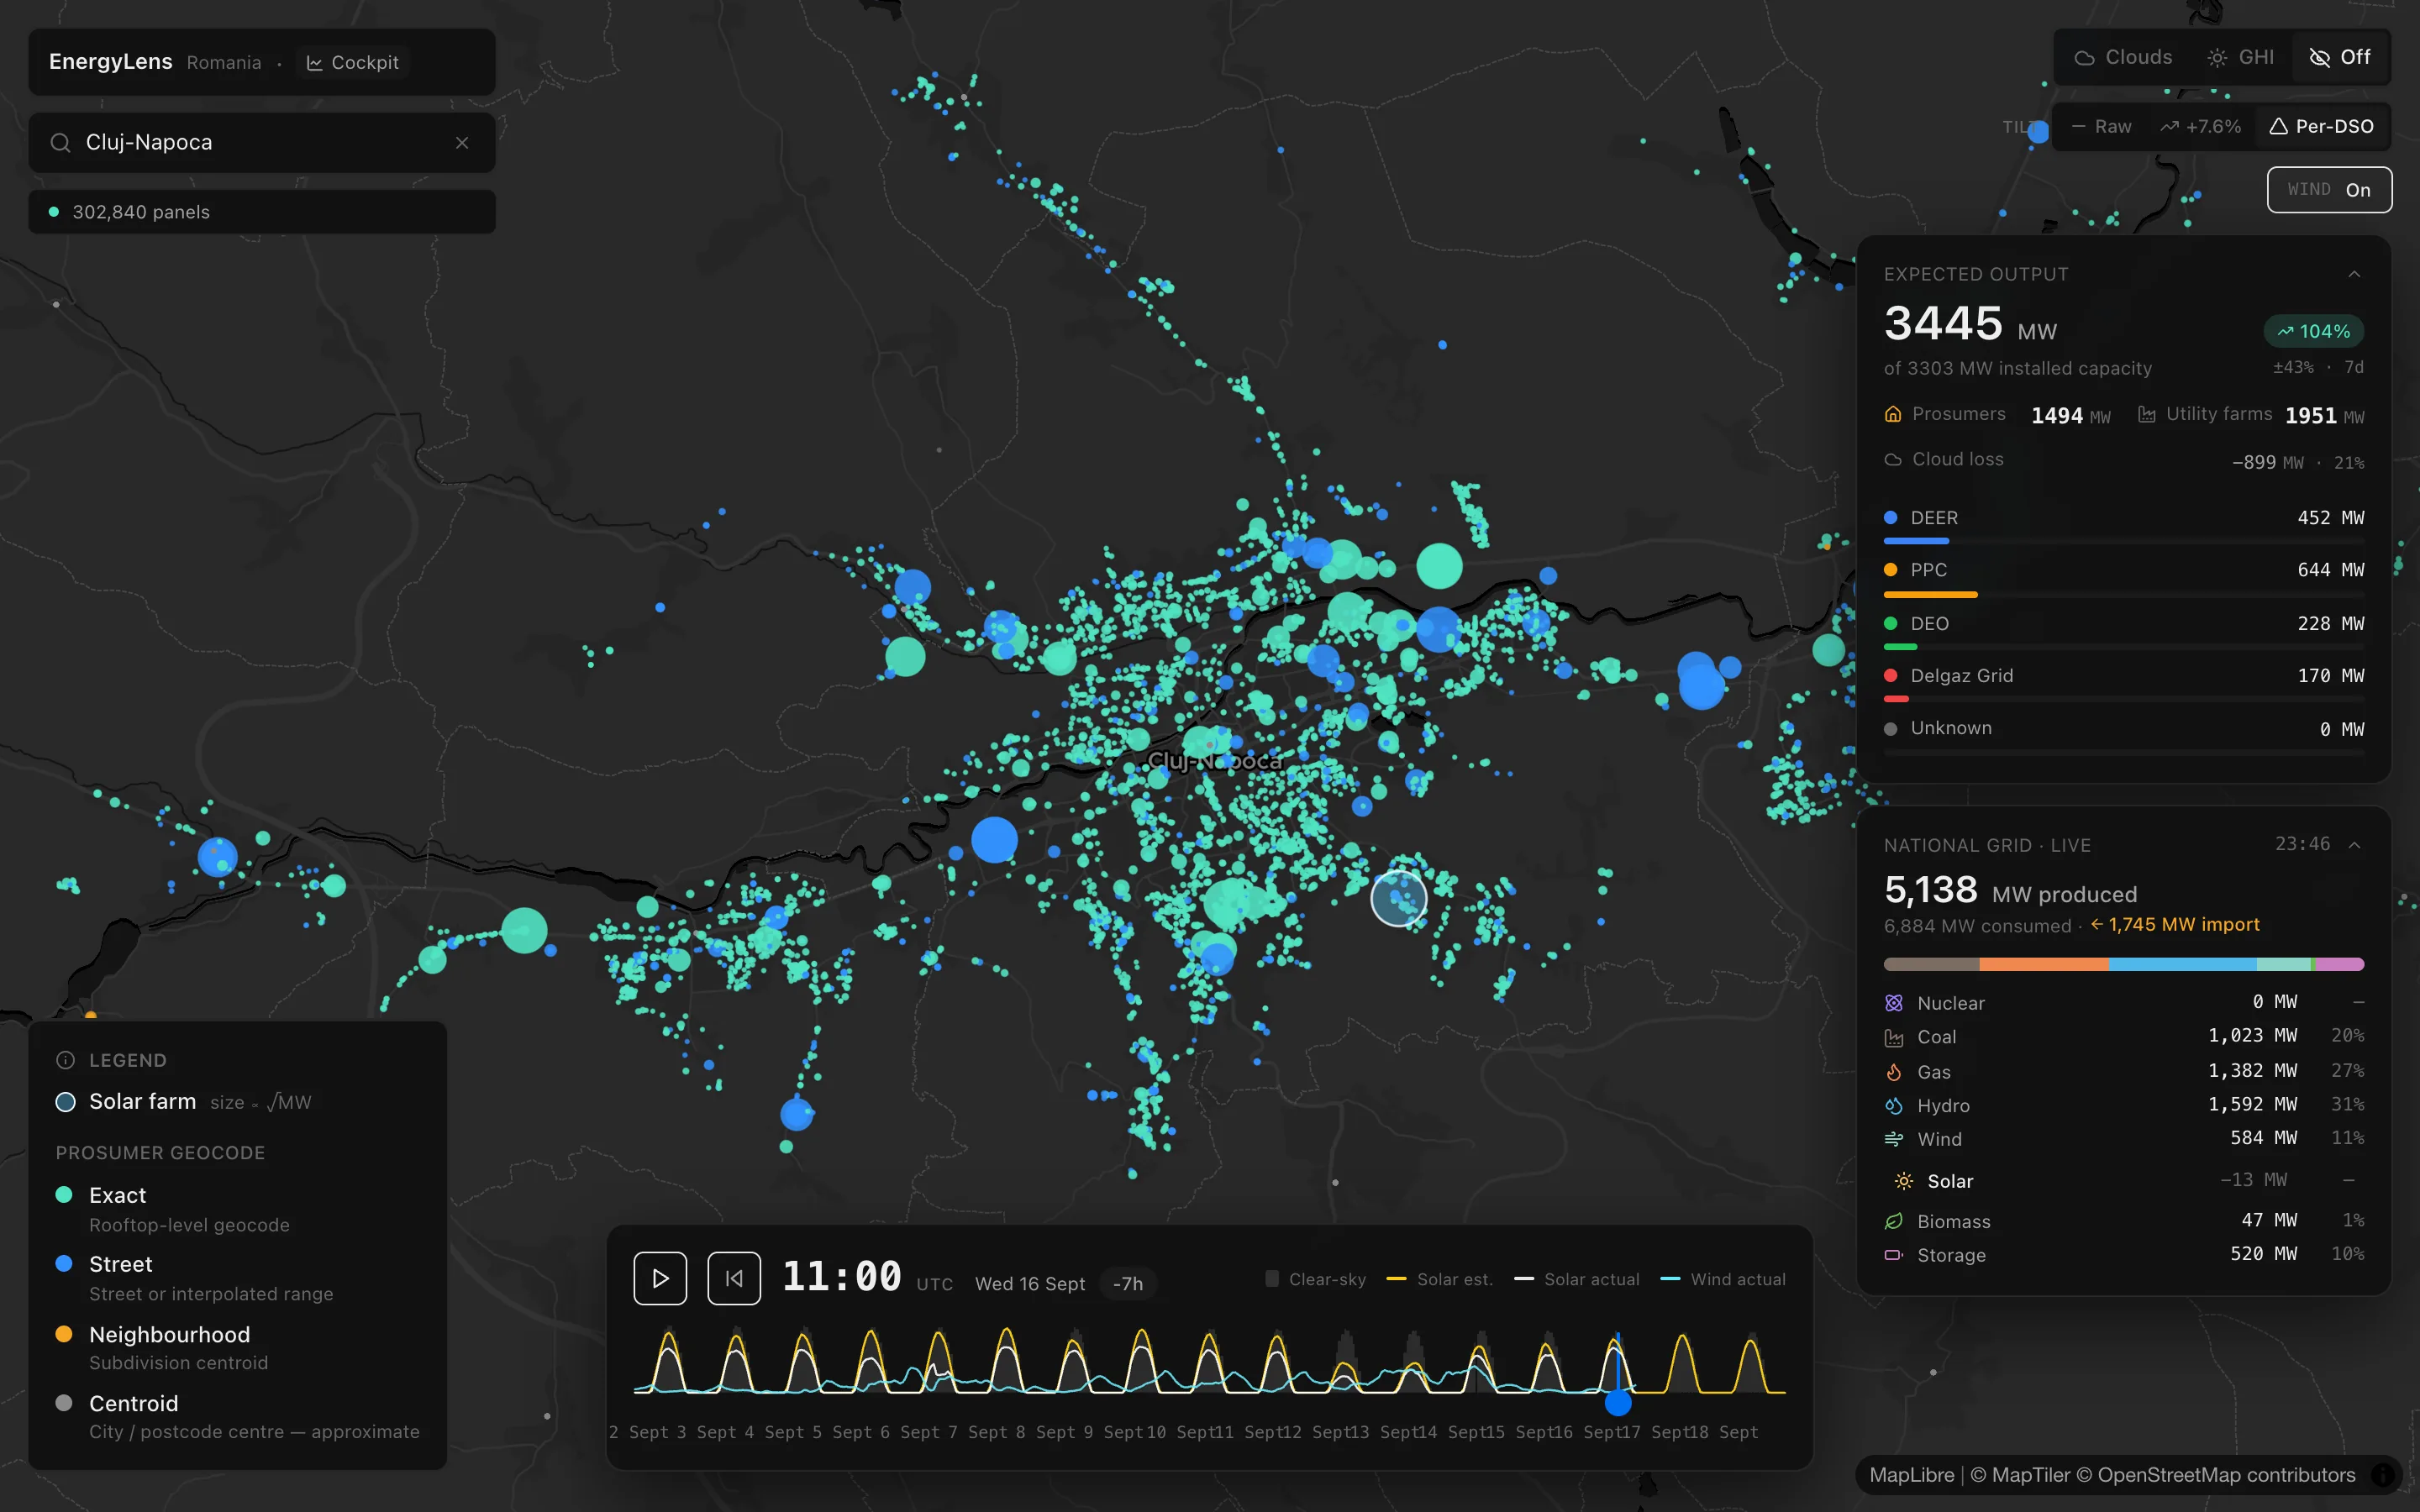
Live grid. Live prices.
Day-ahead prices, residual load, generation stack, cross-border flows and forecast error on one screen, refreshed every 15 minutes. Free to use.
Open the cockpit →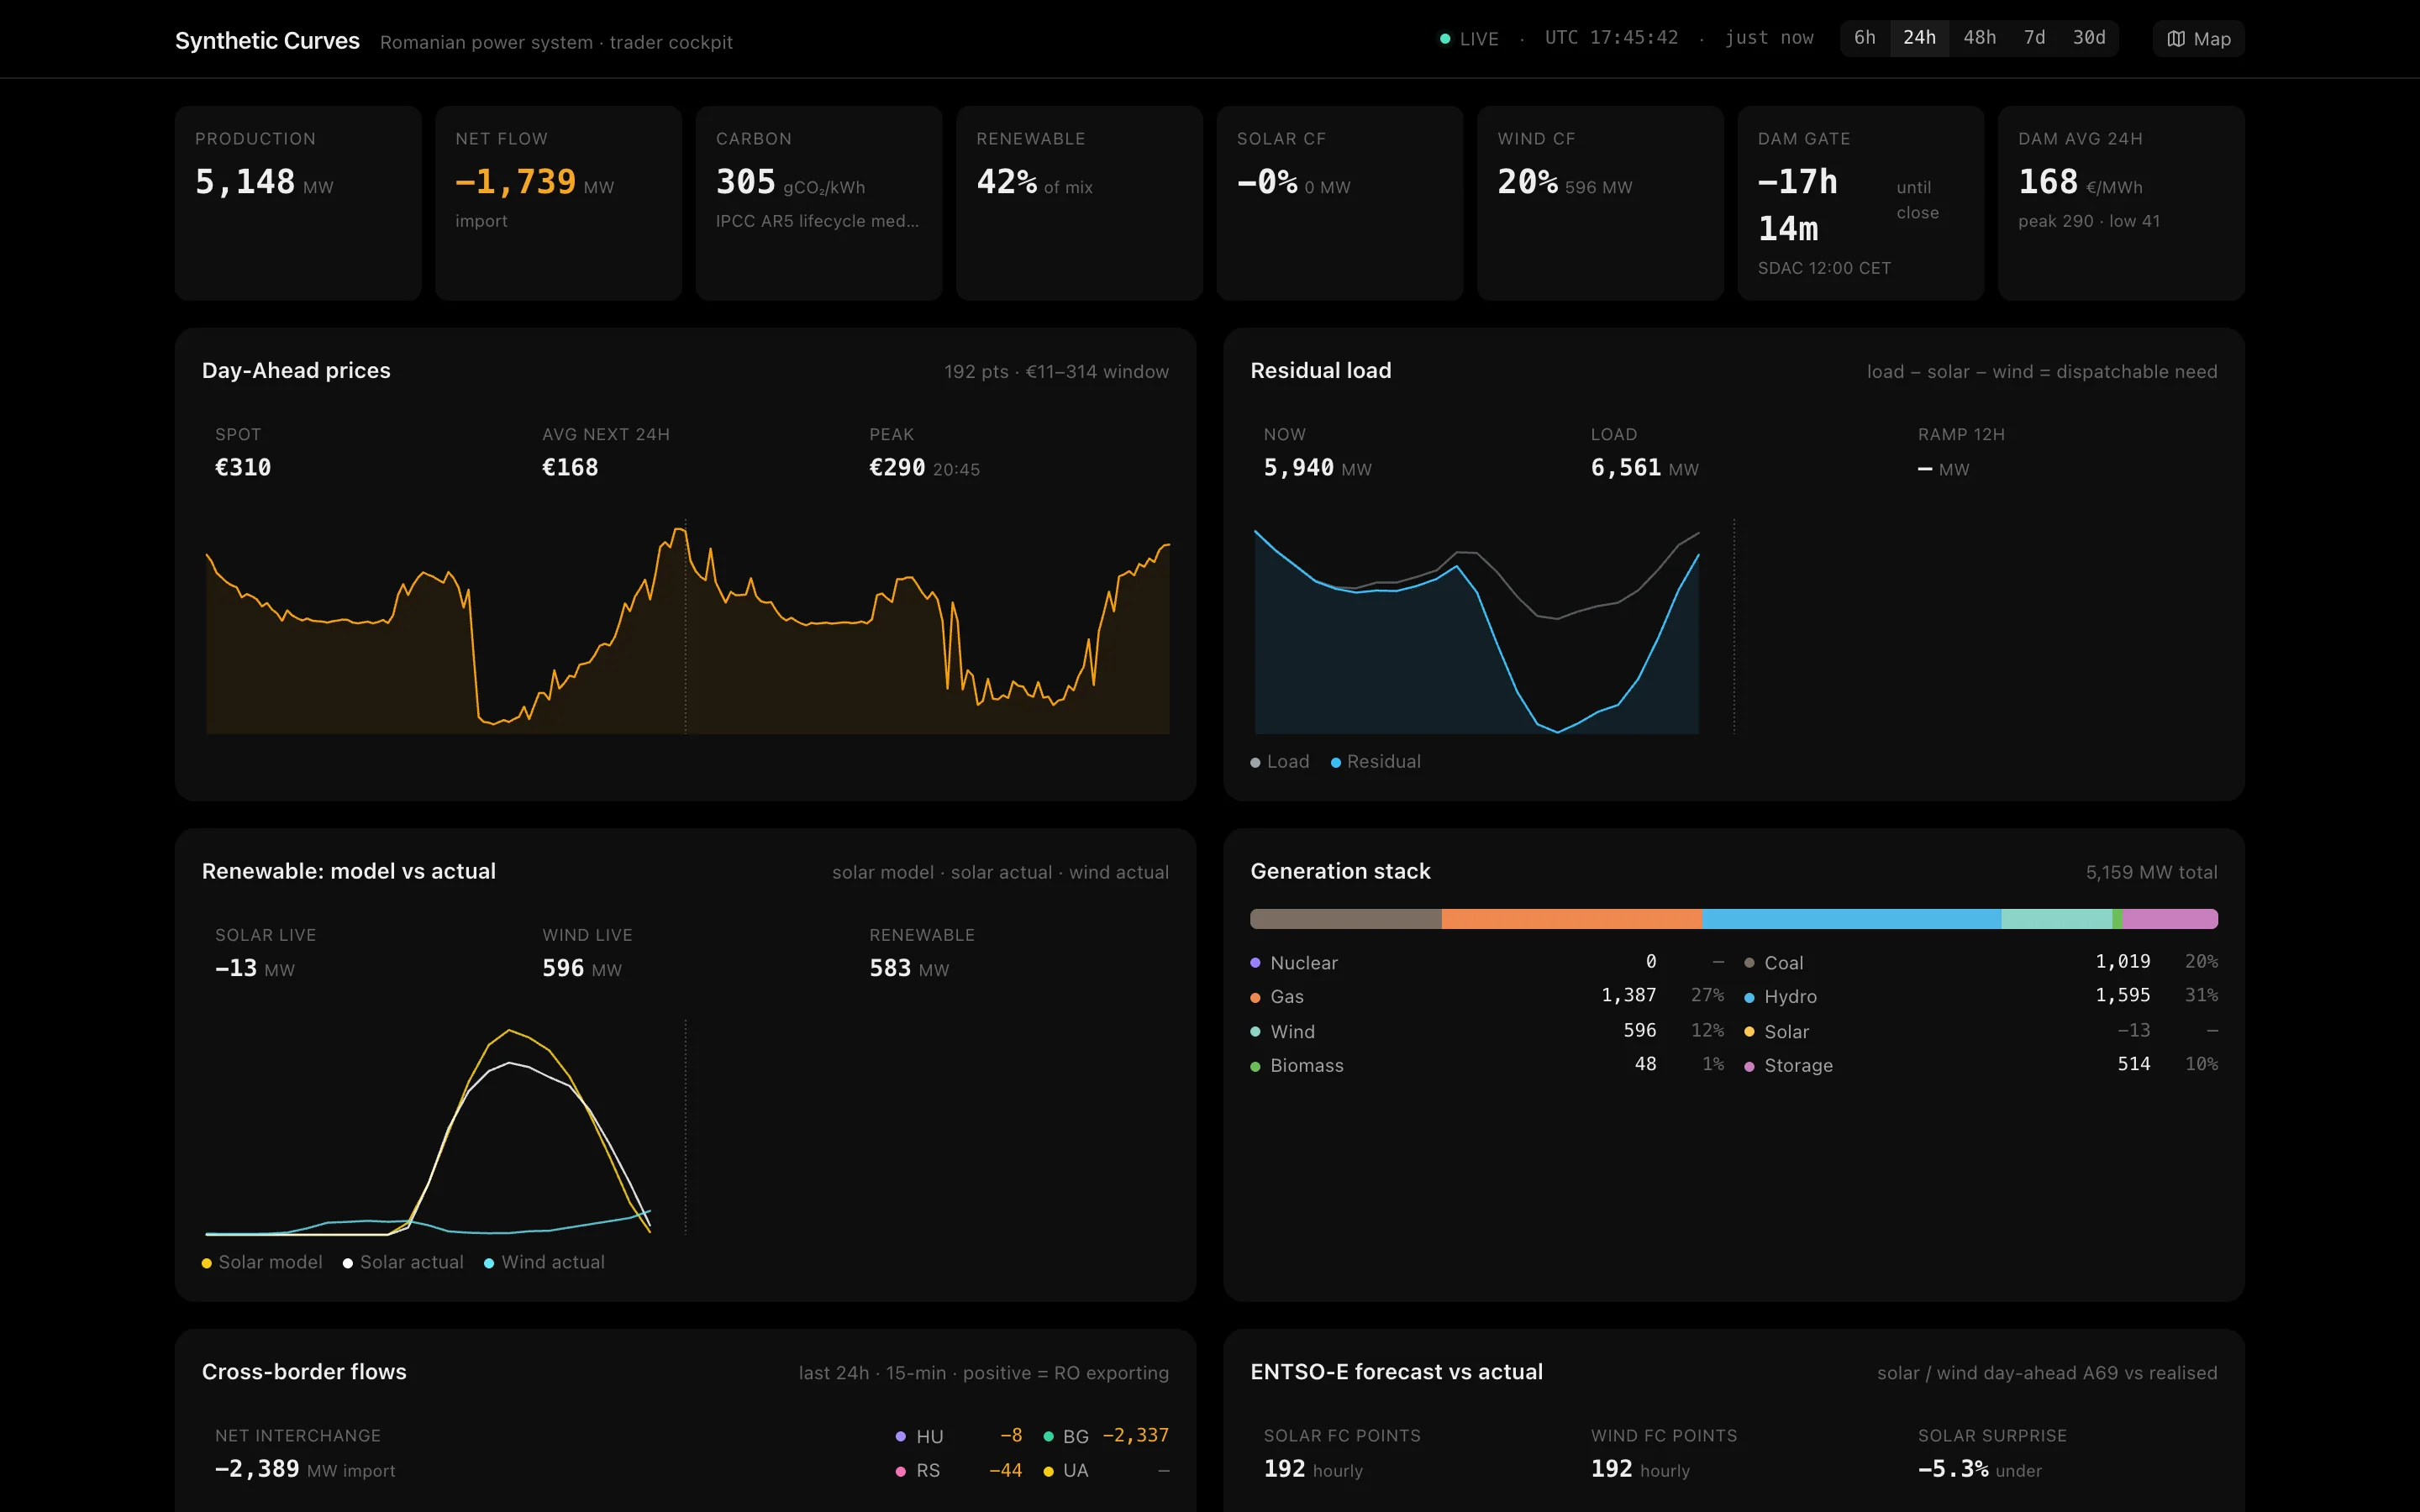
The twelve customers behind a fifth of your cost.
Upload a roster and every POD is matched to its zone, meter and generation profile. DAMAS prices are applied per customer, ranked, and exported as a monthly settlement report.
Book a demo →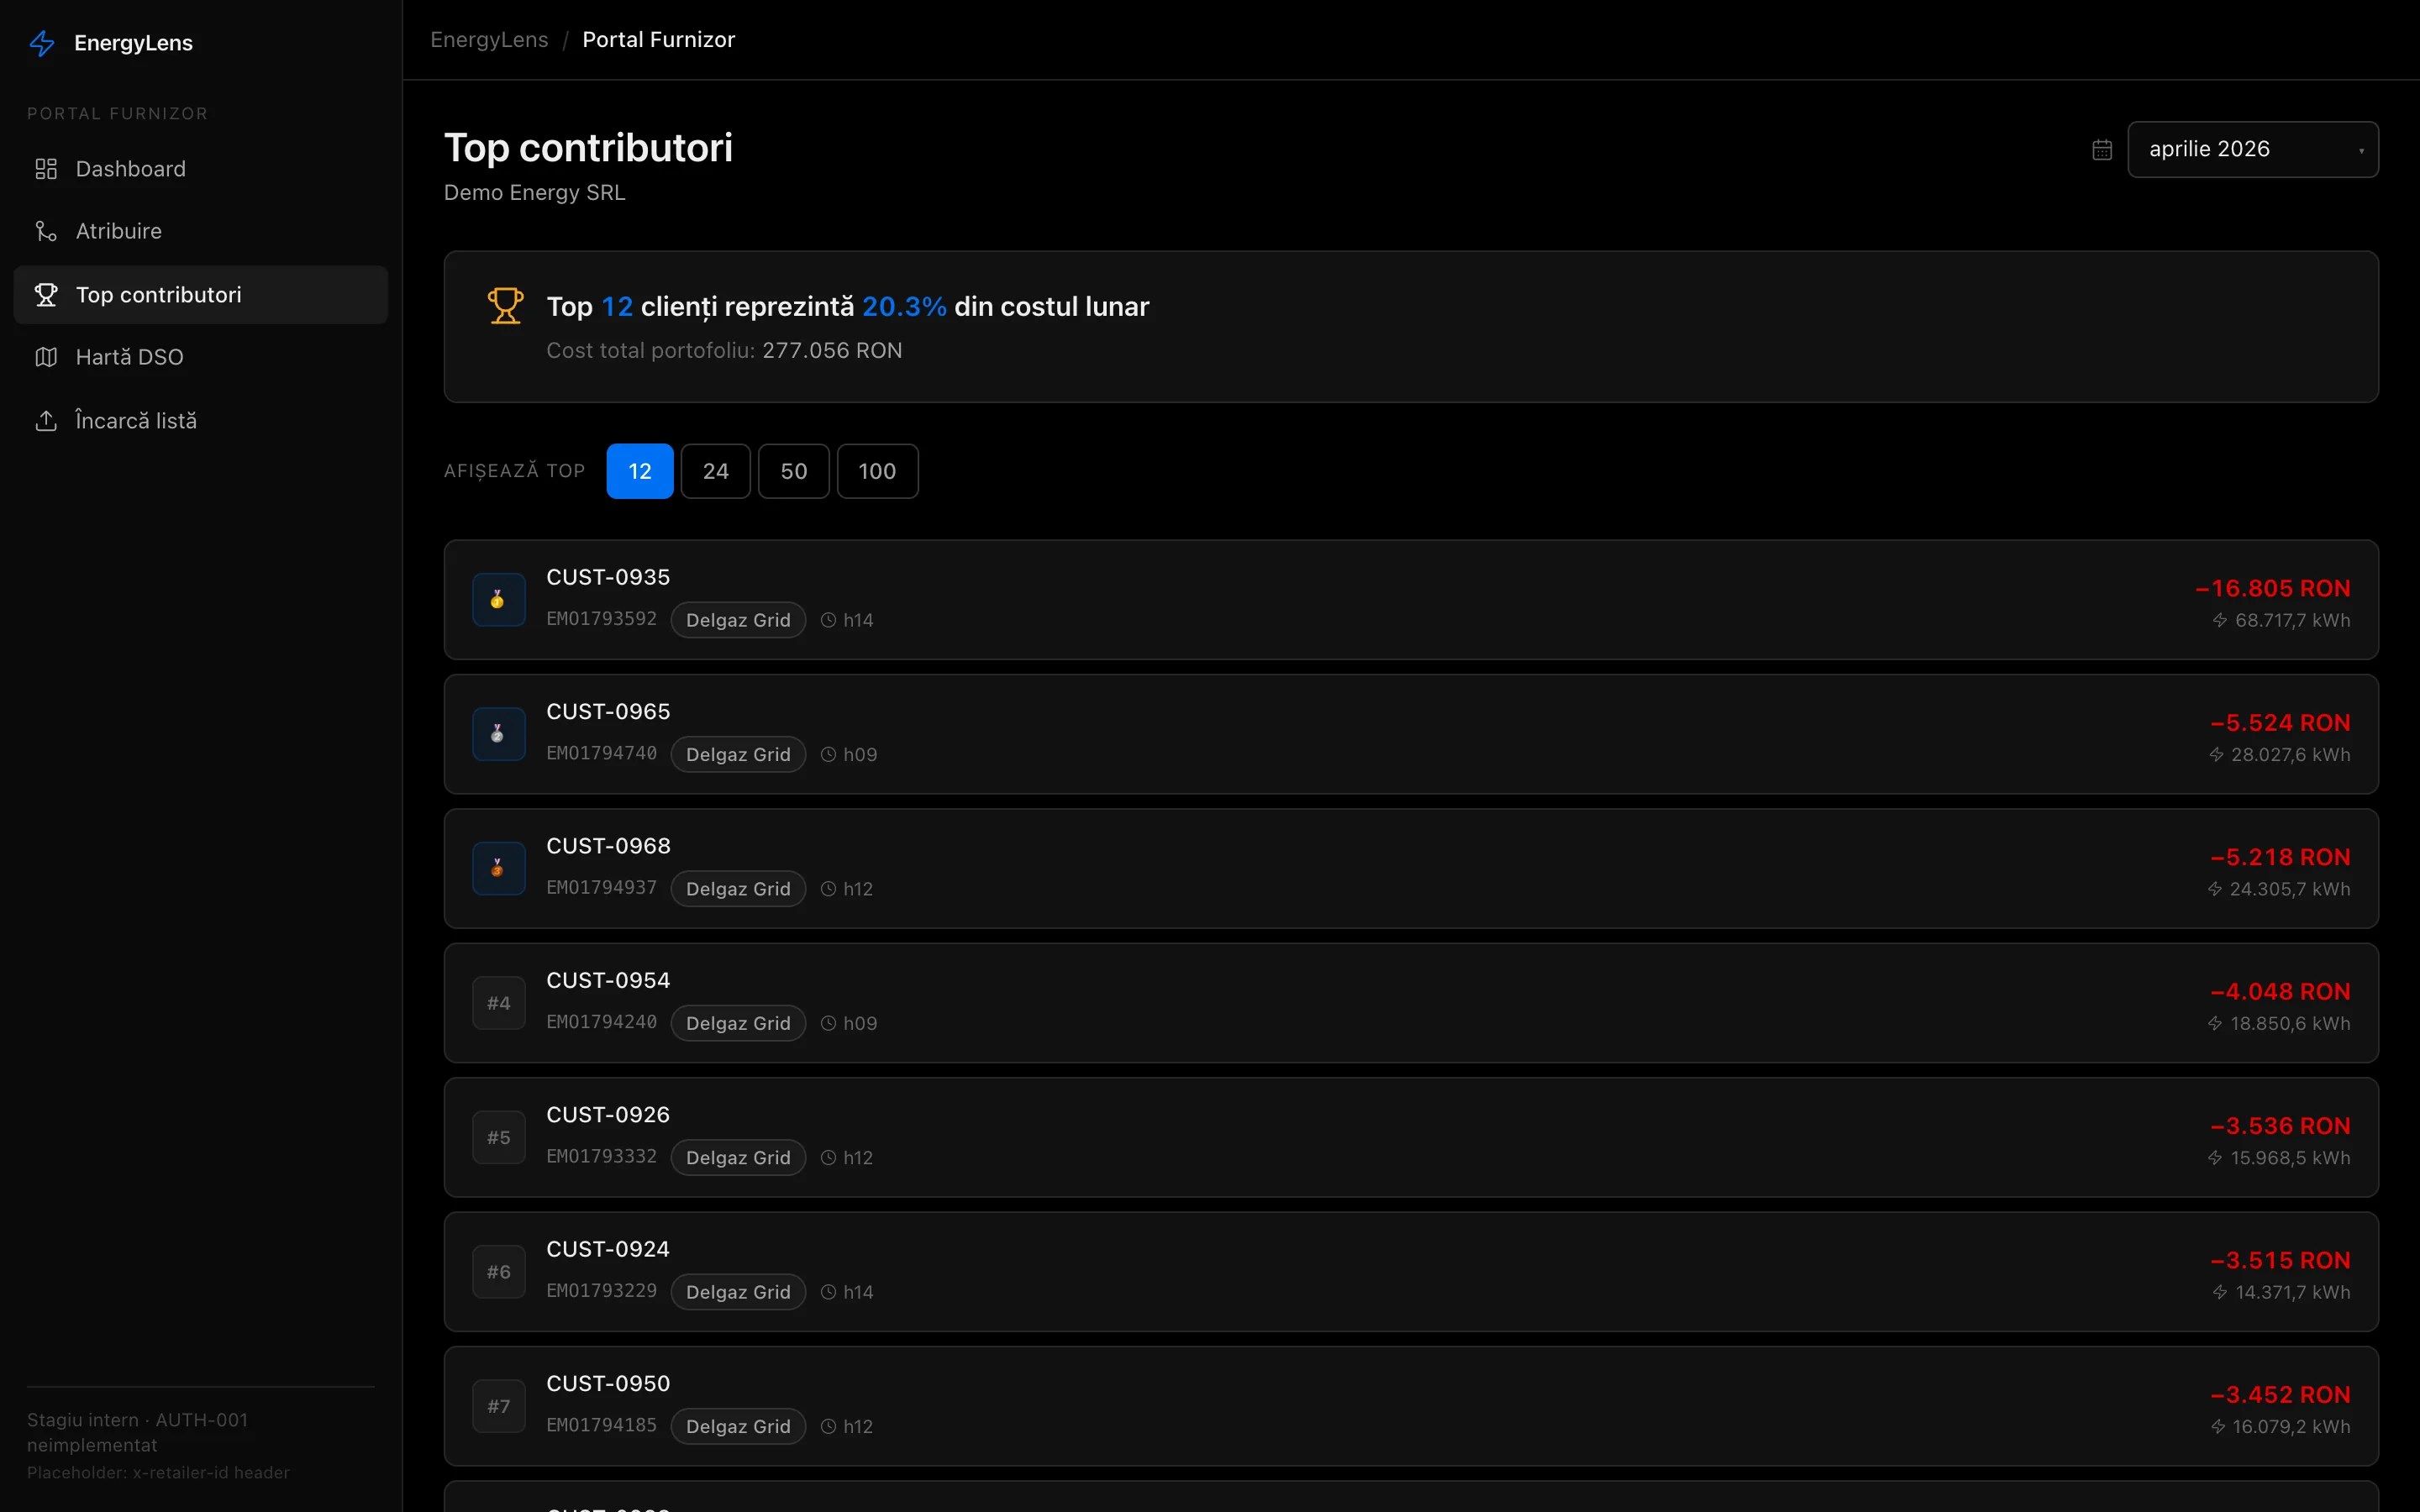
Three steps to settlement.
- 01
Connect your roster
CSV, SFTP or REST, in your existing export format. Messy rows are fine.
- 02
We match every POD
Zone, DSO, county and generation profile, against 312k geocoded prosumers.
- 03
Attribute every day
15-minute DAMAS prices per customer. Monthly PDF and CSV, ANRE-format ready.
Questions
DAMAS imbalance prices arrive within ±2 minutes of OPCOM publication, every 15-minute ISP. The prosumer dataset is refreshed monthly from the four DSO public registries plus ANRE’s licensing portal.